

Server monitoring in Vimonto Deploy measures the CPU, load, memory, disk and network of each server once a minute, shows them in charts, and alerts you by email and in the app when a value stays too high. Heartbeats watch your scheduled jobs: a job calls a URL when it finishes, and you are alerted when that call does not come in time.
You find everything on the server's Monitoring page. The organization's dashboard also shows the charts of all your servers side by side.
How does the monitoring agent work?
The monitoring agent is a small bash script on your server. Cron runs it every minute as root. Each run measures the server and sends the numbers over HTTPS to Vimonto Deploy, using a token that belongs to that server only. Nothing listens on the server: no port is opened and no daemon runs.
| What the agent measures | How |
|---|---|
| CPU usage | The share of CPU time that was busy, measured over one second |
| Load (1 min) | The one-minute load average, with the number of CPU cores |
| Memory | Memory in use (total minus available), as a percentage |
| Disk | Used space on the root disk (/), as a percentage |
| Network | Bytes received and sent on the server's main network interface, shown as Mbit/s |
Vimonto Deploy keeps one measurement per server per minute and deletes measurements after 31 days.
Install the agent
New servers get the agent automatically: it is the last step of provisioning. If a server has no agent, the Monitoring page says No monitoring agent is running yet. Click Install agent; the first measurement appears within a minute.
The agent consists of these files on the server:
| File | Purpose |
|---|---|
/usr/local/bin/vimonto-agent |
The agent script |
/etc/vimonto/agent.env |
Where to send measurements and the server's token (readable by root only) |
/etc/cron.d/vimonto-agent |
Runs the agent every minute |
When the agent stops reporting
If no measurement has arrived for five minutes, the page shows The agent is not checking in, with the time of the last measurement. Check that the server is on and can reach Vimonto Deploy over HTTPS (outgoing traffic to the address shown in the message). Then click Reinstall agent. Reinstalling writes the script again and gives the server a fresh token; only a hash of that token is stored.
Read the figures and charts
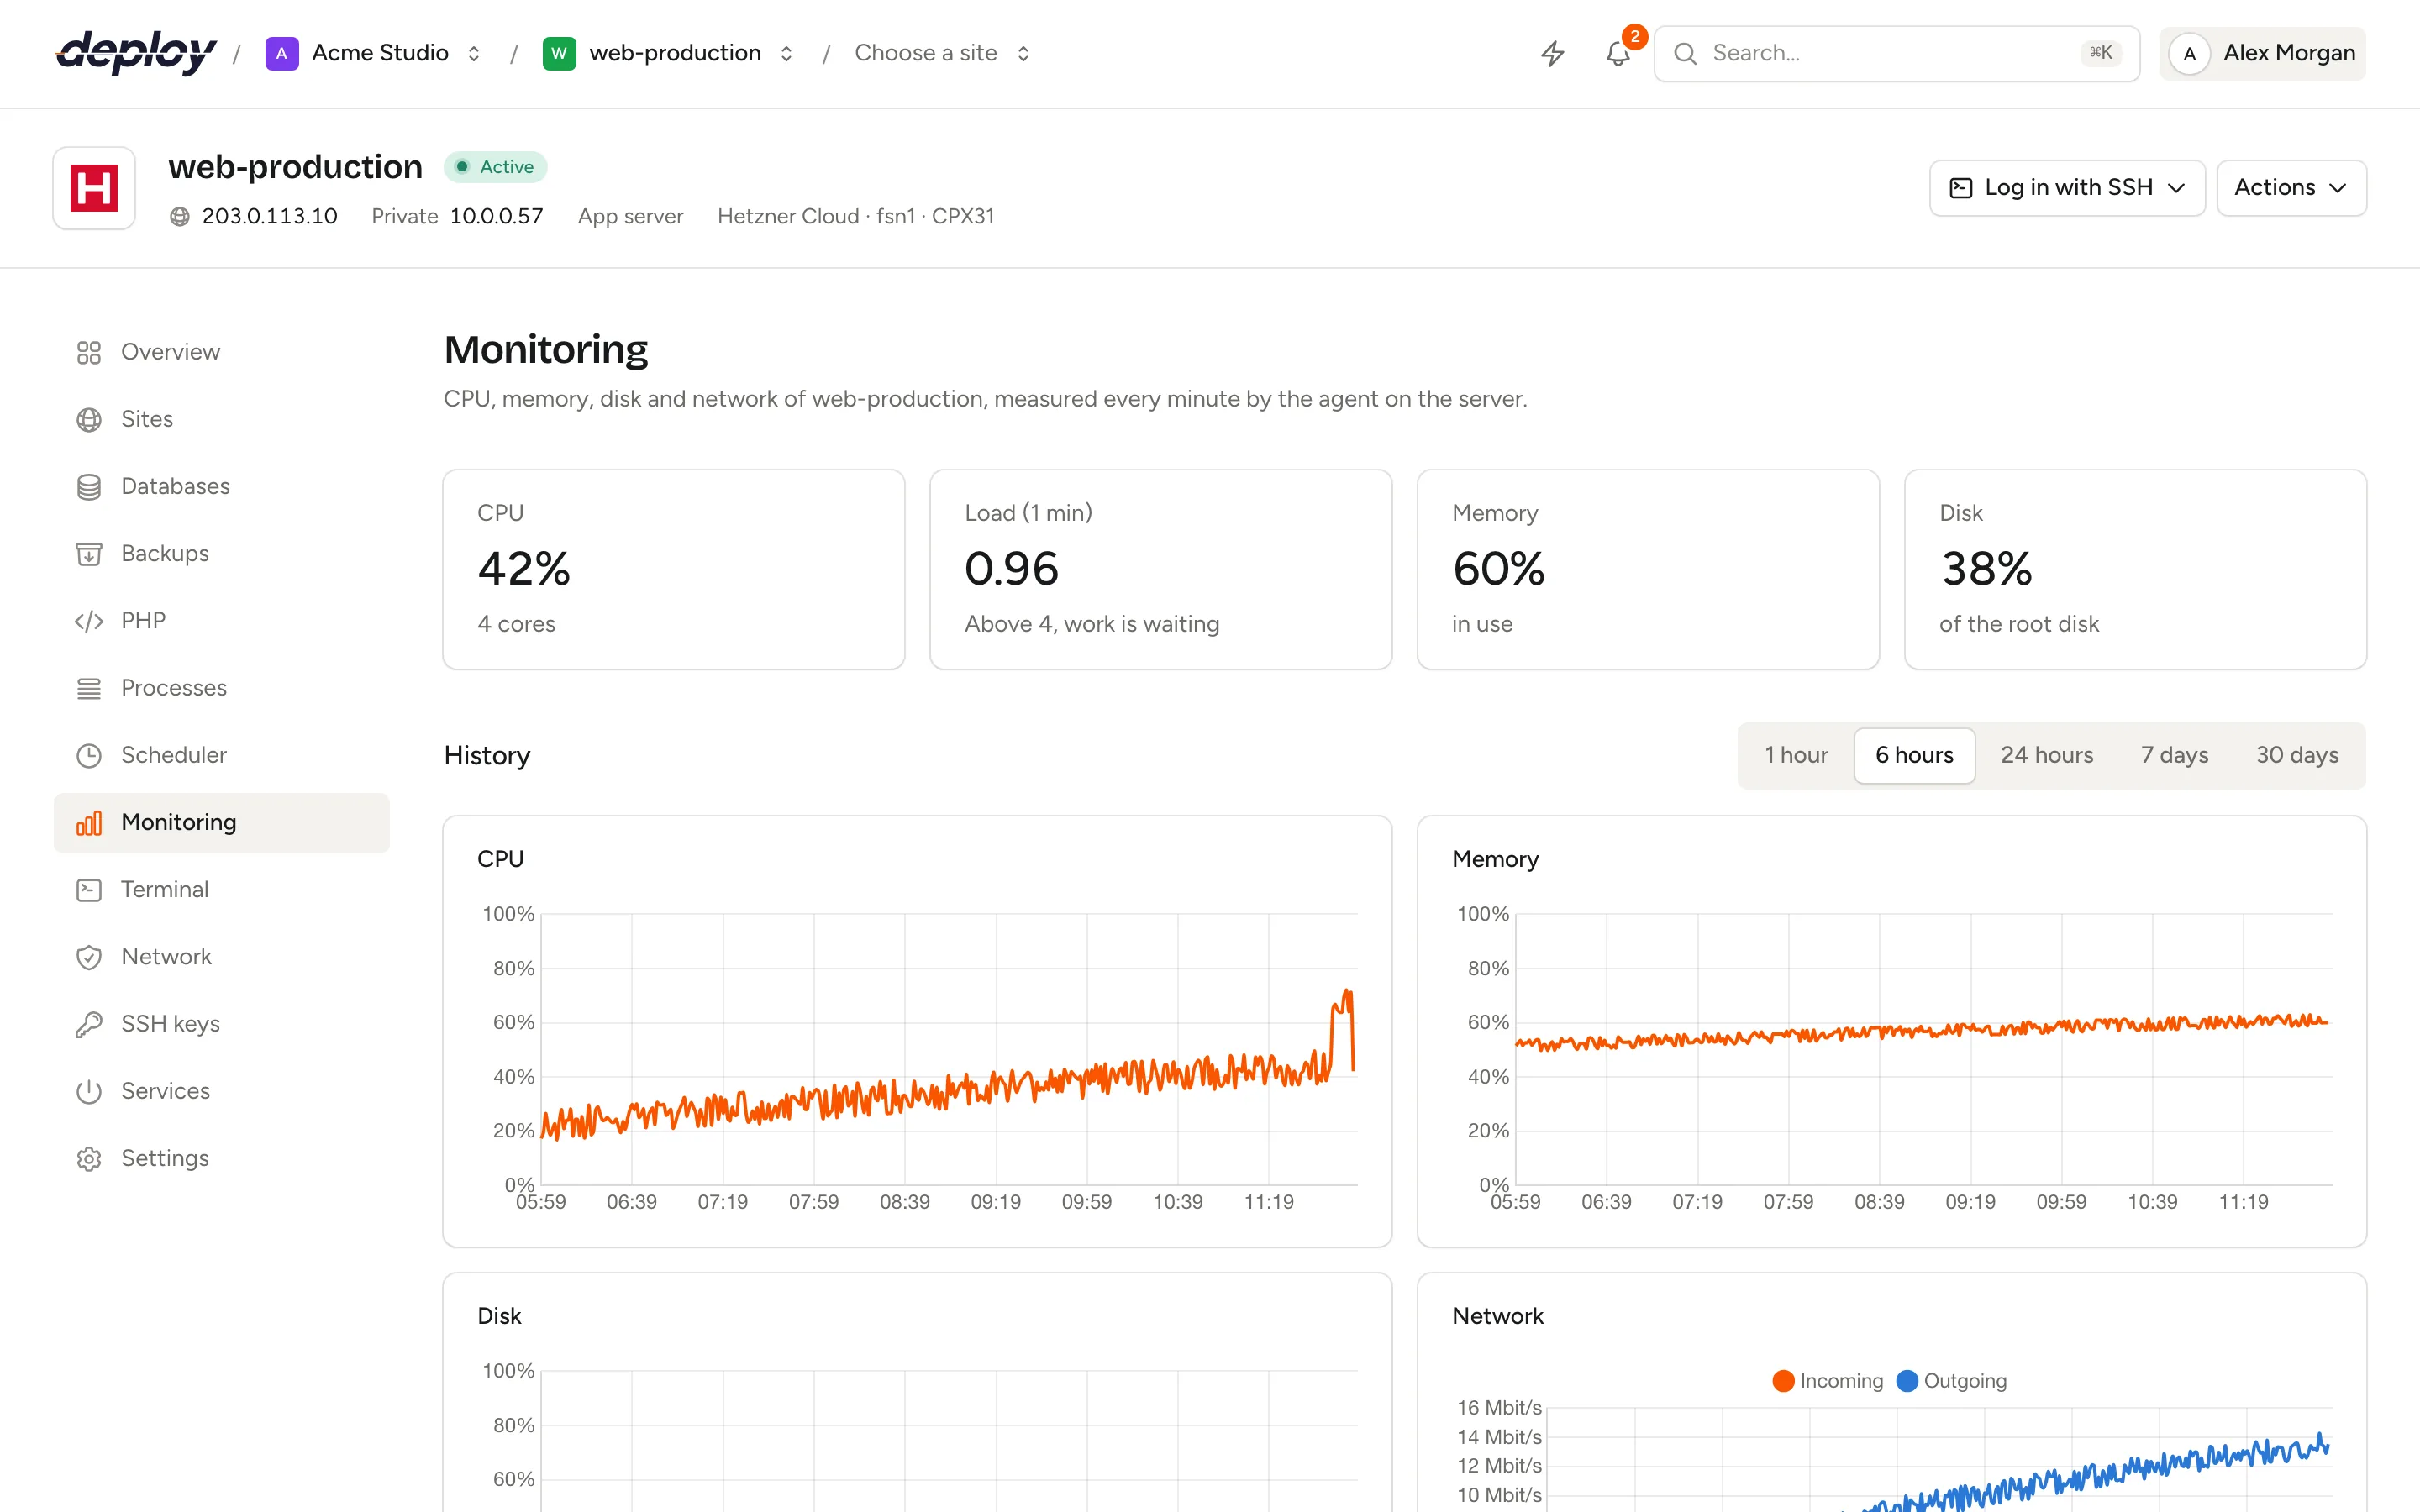
At the top of the page, four figures show the latest measurement:
- CPU, with the number of cores.
- Load (1 min). When the load is higher than the number of cores, work is waiting for the CPU.
- Memory in use.
- Disk, of the root disk.
CPU, memory and disk turn orange from 75% and red from 90%.
Under History, four charts show CPU, memory, disk and network (incoming and outgoing) over time. Choose the range above the charts:
| Range | One point per |
|---|---|
| 1 hour | minute |
| 6 hours | minute |
| 24 hours | 5 minutes |
| 7 days | 30 minutes |
| 30 days | 2 hours |
Longer ranges show the average of each period, so a short spike looks lower there than in the 1-hour view.
Get an alert when a server is under pressure
A monitor sends you an email when a metric stays at or above a threshold for a number of minutes, and again when it is back below.
- Under Monitors, click Add monitor.
- Choose the Metric: CPU usage, CPU load (1 min), Memory usage or Disk usage.
- Enter the Threshold: a percentage for usage, or a load value for CPU load. A load equal to the number of cores means fully busy.
- Enter For (minutes): how long the value must stay at or above the threshold, from 1 to 60 minutes.
- Enter the email address to Notify. It defaults to yours.
- Click Add.
Each monitor is shown as, for example, CPU usage ≥ 90% for 5 min, with its state (All good or Alarm), the latest value and, during an alarm, since when.
When does a monitor send an email?
Every new measurement is checked against your monitors:
- Alarm: the metric was at or above the threshold in every minute of the window. A minute without a measurement counts as not proven, so gaps never trigger an alarm. You get an email with a subject such as Warning: CPU usage on web-1 is 96%.
- Recovered: as soon as the latest value is below the threshold again, the monitor returns to All good and you get a Recovered email.
You get one email when the alarm starts and one when it ends, not one every minute.
Good starting points: CPU usage at 90% for 5 minutes, memory usage at 90% for 5 minutes, and disk usage at 85% for 1 minute. To change a monitor, remove it and add a new one.
Watch scheduled jobs with heartbeats
A heartbeat checks that something happens regularly, such as a nightly backup or a cron job. You get a unique URL. Your job calls it each time it finishes successfully. When the call does not arrive in time, Vimonto Deploy emails you.
Add a heartbeat
- Under Heartbeats, click Add heartbeat.
- Enter a Name, for example Nightly backup.
- Enter Expected every (minutes): how often the job runs. 60 is hourly, 1440 is daily.
- Enter a Grace period (minutes): how long the job may run late before it counts as missed.
- Enter the email address to Notify and click Add.
- Copy the URL from the heartbeat and have your job call it when it is done.
The simplest way is to add the call after the command in the scheduler, so it only runs when the command succeeds:
php /home/vimonto/example.com/current/artisan backup:run && curl -fsS -m 10 https://deploy.example.com/heartbeat/your-token
The URL accepts both GET and POST requests and answers OK.
When is a heartbeat missed?
A heartbeat is due at the time of its last ping (or, before the first ping, the time it was created) plus the interval plus the grace period. Every minute, Vimonto Deploy checks all heartbeats; one that is past due becomes Missed and you get an email such as Missed: Nightly backup on web-1.
| State | Meaning |
|---|---|
| Waiting for the first ping | The heartbeat was added but has not been called yet. |
| Active | The last ping came in time. |
| Missed | No ping arrived within the interval plus grace period. |
You get one email when a heartbeat is missed. When the job calls the URL again, the heartbeat becomes Active and you get an Active again email.
To change the name, interval, grace period or email address, choose Edit in the heartbeat's menu; the URL stays the same. After Remove, the URL stops working and returns a 404.
Who gets notified?
A monitor or heartbeat that changes state notifies in two ways:
- The address under Notify gets an email for the alarm and for the recovery. This address does not need to belong to a member, so a shared team mailbox works.
- Members of the organization who can see the server get a Monitor alert or Heartbeat missed notification, in the app (the bell in the top bar) and by email. Each member chooses these channels, or mutes a server, in their notification settings.
Nobody gets the same alert twice. If the address under Notify belongs to a member who gets Monitor alert or Heartbeat missed by email, the separate email to that address is skipped and the member gets only the notification email. The address under Notify defaults to yours, so out of the box you get one email. A shared mailbox or any other address outside the organization still gets the separate email, and so does a member who switched off email for that kind of notification or muted the server.
Who can change monitoring?
Every member can see the figures, charts, monitors and heartbeats. Adding and removing monitors and heartbeats, and installing the agent, need the permission to manage servers (owner, administrator, manager and developer). Changes wait until the server is active, like on the other server pages. See members and roles.
Frequently asked questions
Does monitoring cost extra or slow down my server?
No. Monitoring is part of the plan. The agent runs for about a second each minute and sends a few numbers.
Why does my server show no measurements?
The agent may not be installed, or the server cannot reach Vimonto Deploy. Install or reinstall the agent from the Monitoring page, and make sure outgoing HTTPS traffic is allowed.
Can I monitor a server with no sites, such as a database or cache server?
Yes. The agent works on every server type.
Can I send alerts to Slack or a team address?
Alerts go by email to the address you enter under Notify, and to members as notifications in the app and by email. There is no Slack integration; enter a shared address, such as your team's mailbox, as the address to notify.
How long is monitoring data kept?
Measurements are kept for 31 days, so the longest chart range is 30 days.